Hi,
Today we will learn how to Apply Column Grouping on Data in a Report in NAV 2013 R2.
Scenario : We want to analyse Customer wise Sales per Month per Year.
To map the report as per our Scenario, We will apply a Row Group on Customer No. and a Column Group on Posting Date's Month and Posting Date's Year each.
1. Create a new report and take "Cust. Ledger Entry" as the DataItem. Select some fields which will help achieve our desired output, as shown below
- Group By : "Customer No"
- Mark Add Group Header and Add Group Footer as True before clicking OK.
The group must be added as shown below,
Click OK, and delete the highlighted columns as we are not going to need them anyway.
Click OK, and delete the highlighted columns as we are not going to need them anyway.
We're done with adding the Row group.
4. Now add a total of "Sales LCY" in Group Footer of this Table, as shown below
5. Now hide the visibility of the Group Header of this Table, as shown below
Hide the Body of the table as well. Only the Group Footer must display in our Desired Result, so leave its visibility to Default(Show).
Now column groups will come into play...
6. Right-Click on the Group Footer of the Table, Click Add Group. In Column Group, Click 'Parent Group...' , a shown below
Tablix group window opens.
7. Click on fx (we need to extract the month of the "Posting Date", fx (expression) will help us). Enter the expression as shown below,
Click OK after entering the expression, then again Click OK on the Tablix Group window.
This will add a Column Group to our Table and the design must look like the one below.
Now, save the Layout and run the report. You must get an output like the one below,
This output lacks our requirement as we need to add another column group of Posting Date's Year. Also for a better UI we will show month names instead of month nos. So now we will add these as well.
8. Right-Click on the Column Group you just created, Click Add Group, Click Parent Group.
Add group by expression in the same way you did in step 7.
Add group by expression in the same way you did in step 7.
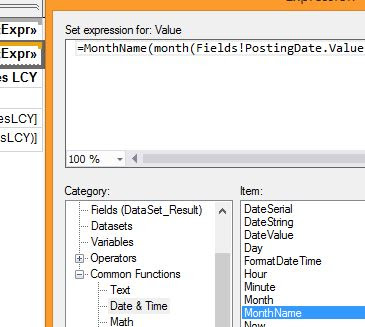
9. Now we will extract the month name from the month no. to improve report's UI. Add MonthName function to the expression of Month group's Text Box.
10. Save the report and execute it through development environment. You will get an output as shown below.
Cheers!!!
Ishwar
Post your comments and doubts I will be happy to answer them.


No comments:
Post a Comment